JVM Memory Spaces
This post is about:
- what Java Memory Spaces are
- why they are such a good idea
- the spaces and their use in the JVM
- how to measure their usage in practice
- where to find more documentation about them
It will help you better understand concepts like:
OutOfMemoryErrorPermGenheap memory- etc.
Why the need for Memory Spaces?
The JVM frees unreferenced memory via an entity called Garbage Collector (or GC for short). Every time the GC claims memory, it executes these steps:
If these steps were to be applied to a flat memory space, the process of freeing memory would become proportionally as slow as the amount of memory used. In other words, the more classes loaded, the more memory segments to explore every time memory is claimed.
As you could imagine, things get better if the GC is aware of the odds an object is eligible for disposal.
In a simplified version of reality, the GC considers a class object to be permanent (as it will probably live as long as the JVM).
On the other hand, the GC considers objects created with the new keyword as more likely to have shorter life. The GC discriminates very short life from medium life and long life by keeping count of the amount of times an object survived a GC cycle. Objects survive a GC cycle when they are still referenced (hence their block of memory is marked, preventing it from disposal).
Objects that survived some GC cycles are less eligible for disposal soon, and we can say they change their generation.
This categorisation of objects into generations really exists, and is materialised in JVMs via Memory Spaces, or more precisely Generational Memory Spaces.
What are the Memory Spaces in Java?
Strictly speaking, the Java Memory Spaces really depend on the Java VM implementation, but in general terms they can be divided into:
No PermGen Space in JDK 8?
Exactly, no more PermGen.
In JDK 8 the permanent generation was removed. The class metadata is allocated in native memory instead.
The amount of native memory that can be used for class metadata is by default unlimited. You can use the option MaxMetaspaceSize to put an upper limit on it.
In practice, can I measure the use of Memory Spaces?
You can use jconsole for that. This tool will show you:
- the use of Memory Spaces
- the threads in your JVM (with name, status, stacktrace, etc.)
- loaded classes
- exposed MBeans
- and more!
Example
We will use the Scala REPL as an example:
scala
We will open jconsole and hook to the just launched JVM (using its PID).
jconsole <PID>
to hook to the corresponding JVM.
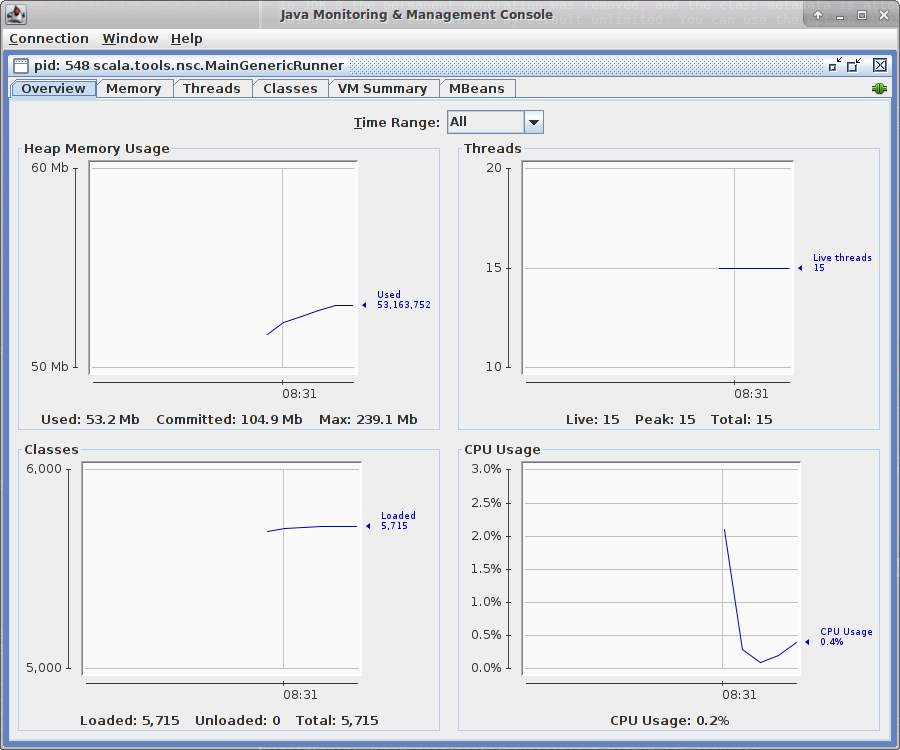
What I see initially is:

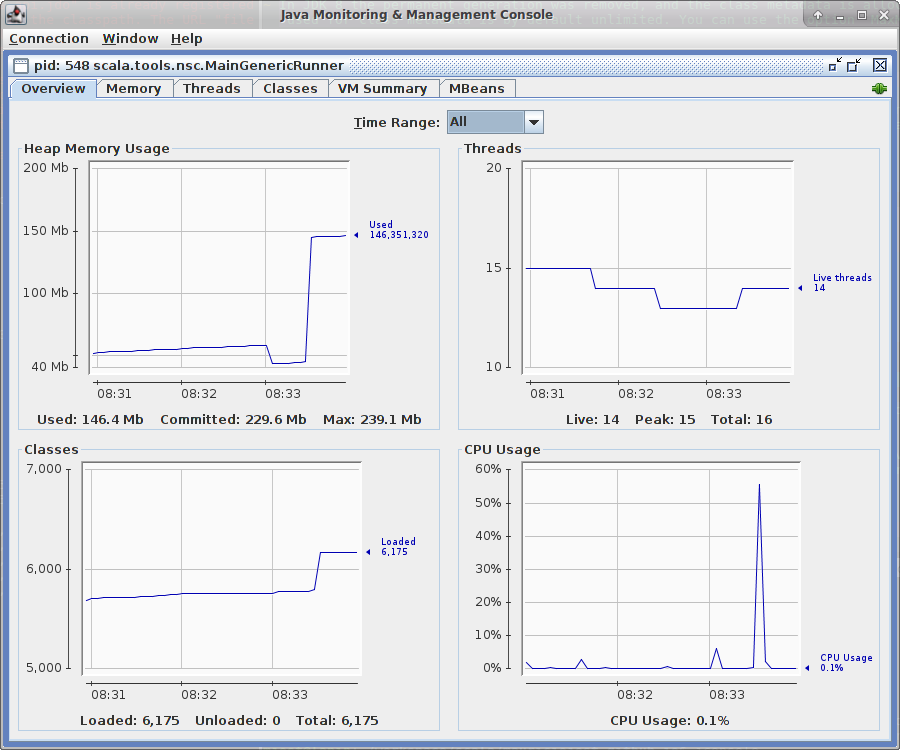
However, if you perform a GC and then you create lots of objects with:
val a = (1 to 1000000).toList.map(_.toString)
You will see:

Can you explain:
- what happens to the Heap Memory Usage when we launched the GC? It drops, used memory was marked, letting GC dispose unused blocks of memory, freing it for new objects to use it.
- what happens when we created objects in Scala? See how the heap usage increases by about 100MiB. There is one new big object
val aallocated.
And more generally:
- what happens to the Loaded classes? They increased by the team
val awas instantiated given the lazy class loading. - what happens to the use of CPU? There is a peak when
val awas instantiated. Can you see it?
References
There is really lots of documentation about this topic. Whenever you read documentation about it, I suggest you to double check the version of the JVM it relates too.
- General documentation from Oracle about Java
- [Java Garbage Collection Basics] (http://www.oracle.com/webfolder/technetwork/tutorials/obe/java/gc01/index.html)
- JAVA SE 7
- JAVA SE 8
- JAVA SE 9
Also, do not forget man java. If java was not installed properly via a package manager, you can still try to read the manual with man. For example:
man --manpath /home/mjost/opt/zips/jdk1.7.0_79/man java
Enjoy!
