Dump your JVM
This is a ultra-short post on JVM debugging tools. Did you get an OutOfMemoryError and have no idea how to proceed? This post is for you.
An example for memory analysis
I’d like to start with a dummy application as example. We will make it run and analyse its memory heap. With the tools I will introduce you can analyse many other indicators, but the procedure to get to that point hast the same initial steps. Once in the tool you can explore by yourself.
This application simply will create a huge amount of UUID instances and keep them in memory for a while. If we analyse it correctly, we should see them somewhere in our memory heap. So let’s get started.
Put in Main.scala the following:
package com.mauritania

import java.util.UUID.randomUUID

object Main {
  val Nb = 1500000

   // my unique id string dummy class
  case class Myuids(ui: String)

  def main(args: Array[String]): Unit = {

    val u = (1 to Nb).
      map(_ => Myuids(randomUUID().toString))

    java.lang.Thread.sleep(3600 * 1000)

    u.foreach(println)

  }

}
Clearly we’re allocating many Myuids instances.
Launch it as follows (using scalac 2.11.7 here):
scalac Main.scala
scala com.mauritania.Main
Generating heap dumps
There are sevaral ways to generate heap dumps (.hprof files) before we can analyse them:
- Using
jmapJDK’s tool as follows:
jmap -dump:format=b,file=heap.hprof <pid-of-running-jvm>
- Connecting to JVM via
mattool - Connecting to JVM via
jmctool - Connecting to JVM via
jvisualvmtool - Requesting the JVM to dump the heap on OOM using the following JVM settings:
-XX:+HeapDumpOnOutOfMemoryError
-XX:HeapDumpPath=/tmp/heap.dump/
Analysing heap dumps
Eclipse Memory Analyser (mat)
The easiest way of analysing memory heaps is using mat tool.
- Download the standalone Eclipse Memory Analyser (EMA, or
mat). - Open
mat
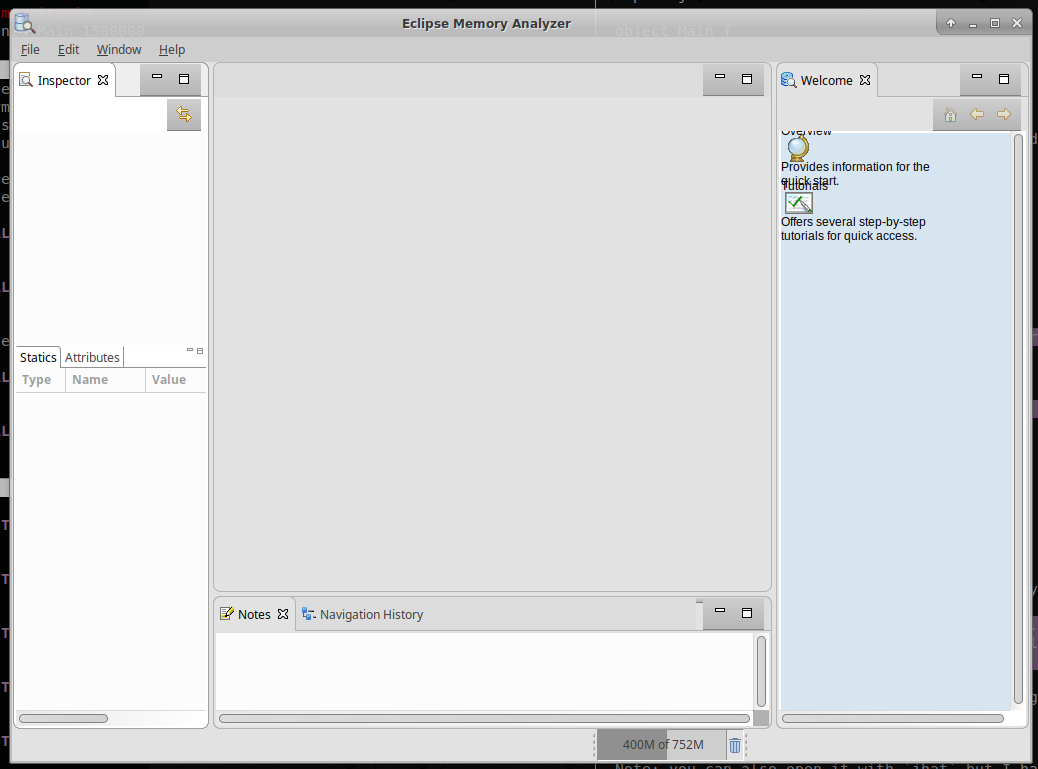
- Get the memory dump of the just started JVM, it must be an
hproffile. - Choose the
Component report
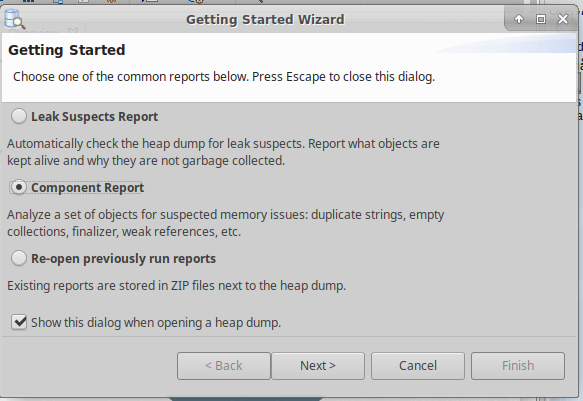
- Point to the package you’re monitoring (in a regex), for instance
com\.mauritania\..* - Now you must see a pie chart.
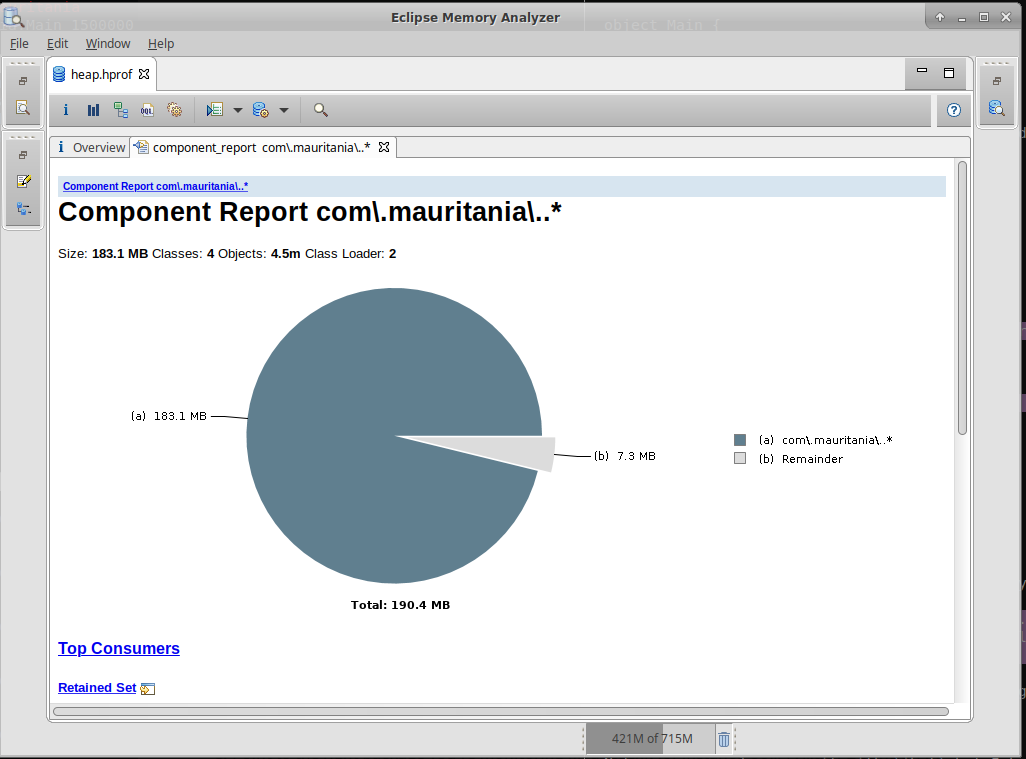
- Click on
Top Consumers, see their size in MB.
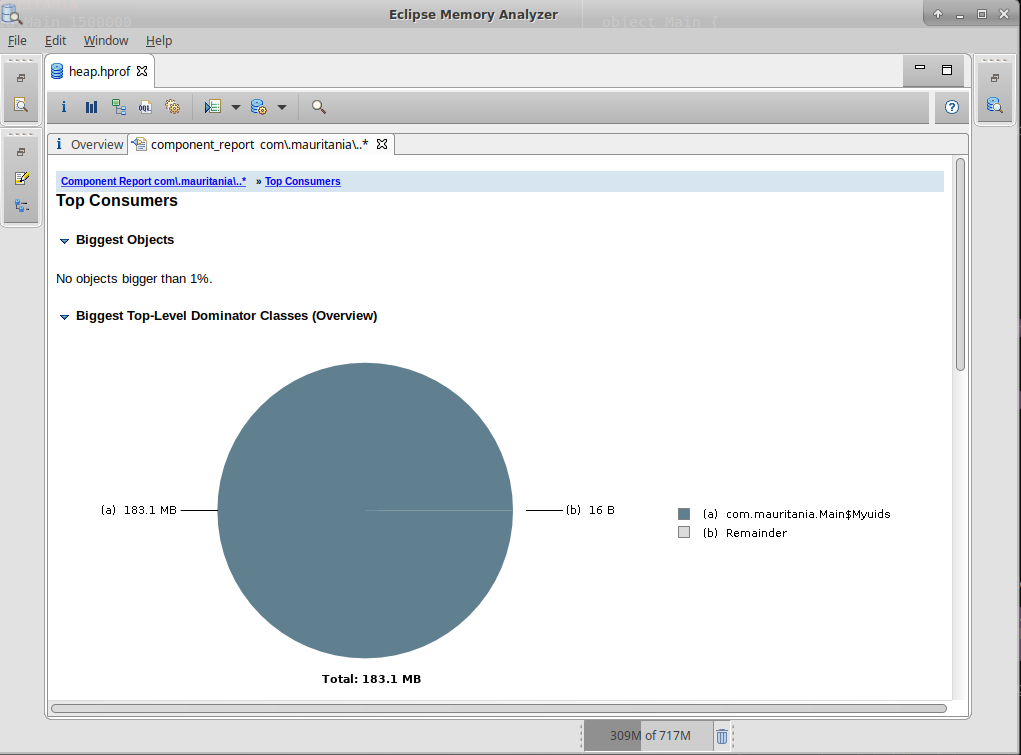
The chart shows how Myuids instances are occupying the heap, just as expected.
Note: normally you can also open .hprof files with jhat.
Java Mission Control (jmc)
Let’s now use jmc.
- Add the following settings to your JVM:
-XX:+StartAttachListener
-XX:+UnlockCommercialFeatures
-XX:+FlightRecorder
-XX:FlightRecorderOptions=
  defaultrecording=true,
  dumponexit=true,
  dumponexitpath=/tmp/jfr/,
  repository=/tmp/jfr/,
  disk=true
-XX:+HeapDumpOnOutOfMemoryError
-XX:HeapDumpPath=/tmp/heap.dump/
- Upon an
OutOfMemoryErrortheHeapDump*settings will make the JVM create a heap dump under/tmp/heap.dump/java_pidXXXXX.hprof - Upon exit the
FlightRecorder*settings will make the JVM create a report under/tmp/jfr/hotspot-pid-XXXXX-id-XXXXXXXXXXX.jfr(which does not have memory heap exhaustive information, but more general indicators)
Regarding our own application, it is enough to launch our application as follows, as all I wanted is to connect to the JVM without dump files:
java -cp .:<path-to>/scala/lib/scala-library.jar \
  -XX:+UnlockCommercialFeatures \
  -XX:+FlightRecorder \
  com.mauritania.Main
- You can open the
.hprofheap dump as seen in the sections above. - To open the
.jfryou need to useJava Mission Control(tool from jdk:jmc) - Instead of opening an existent
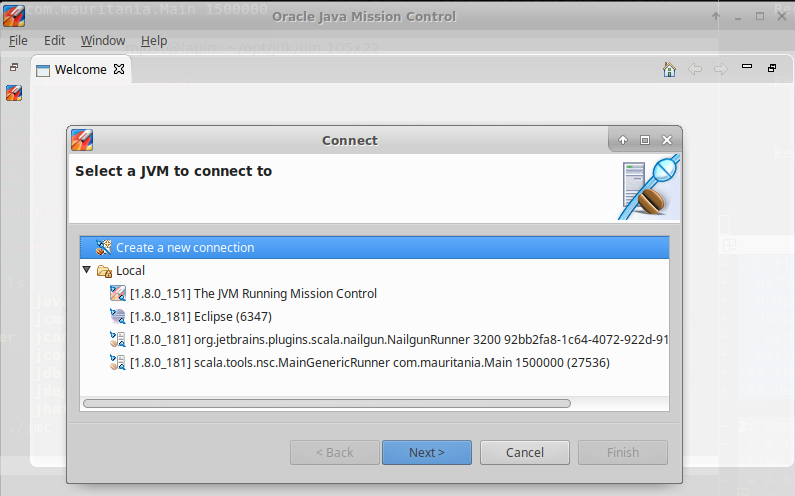
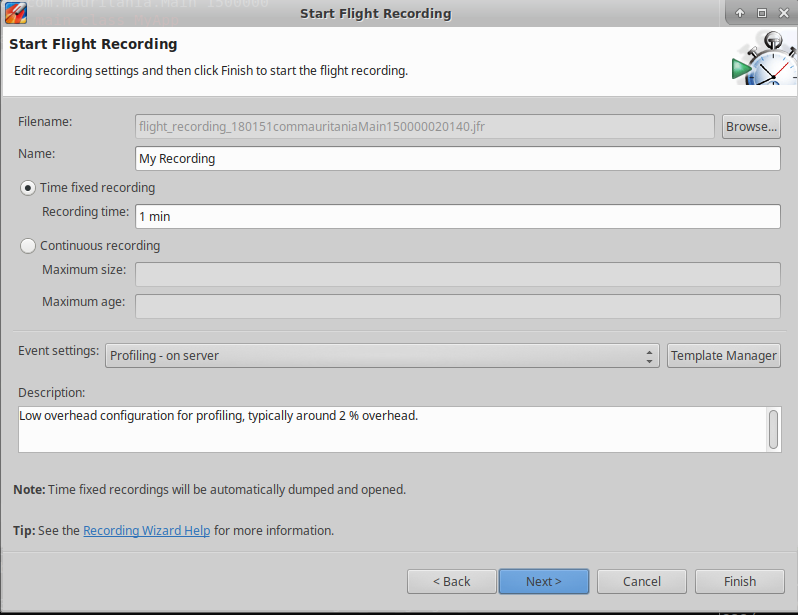
.jfryou can makejmcconnect to an existent JVM, as follows:
a. Create a new connection
b. Set up the recording settings
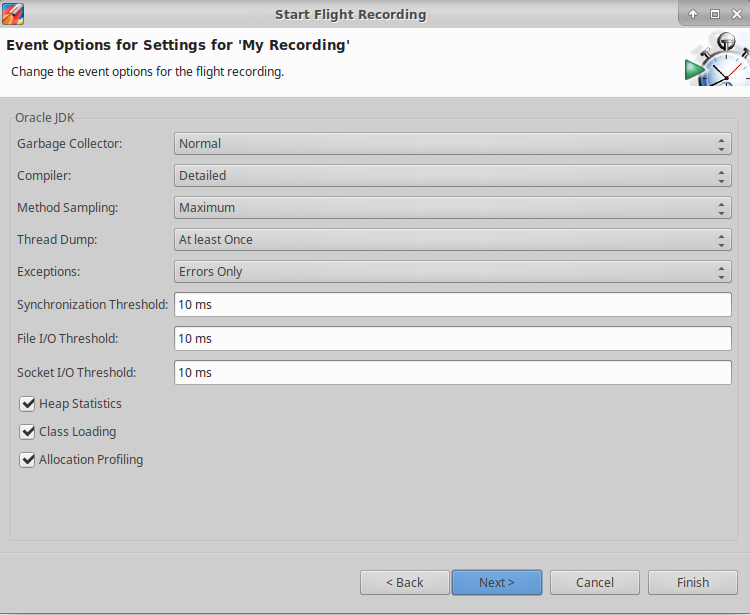
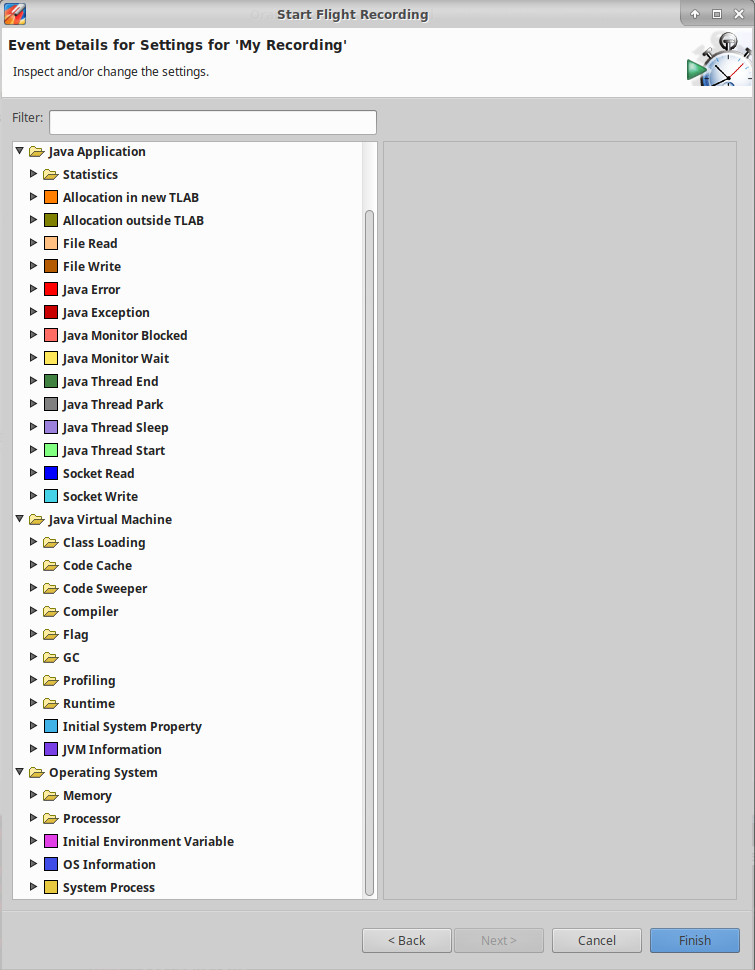
c. Interestingly you can request jmc to record certain events from the JVM, like file open event. This can be useful if you consider your application is slow because it has too much IO.
d. Start recording
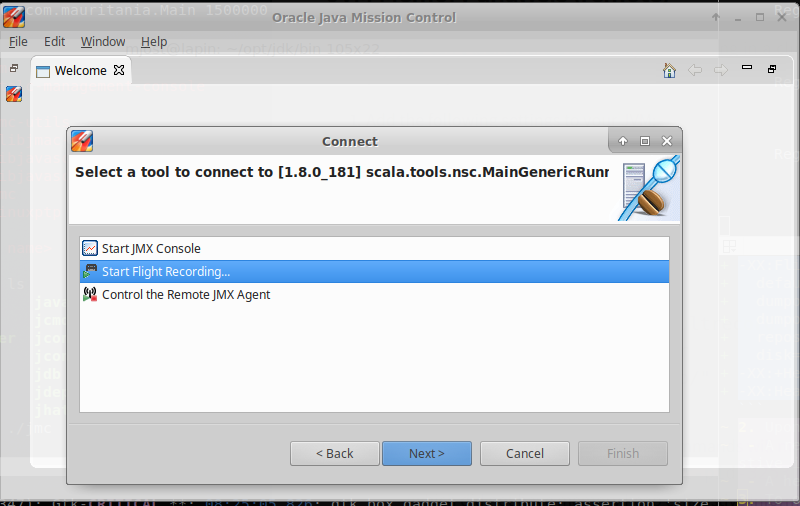
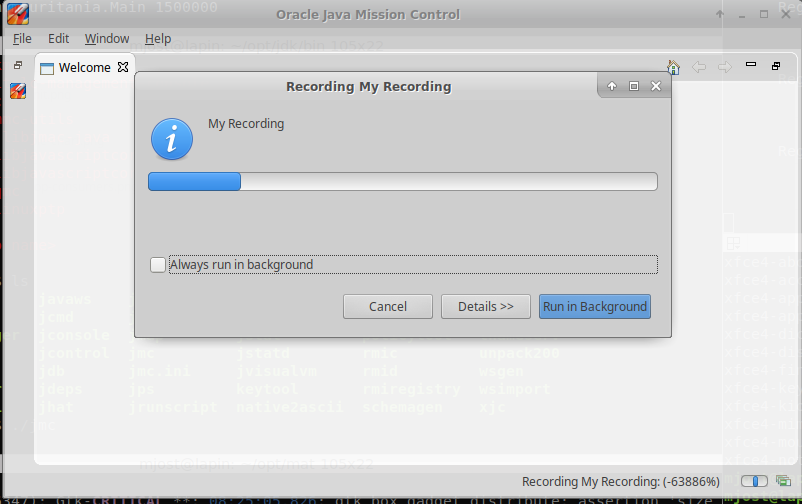
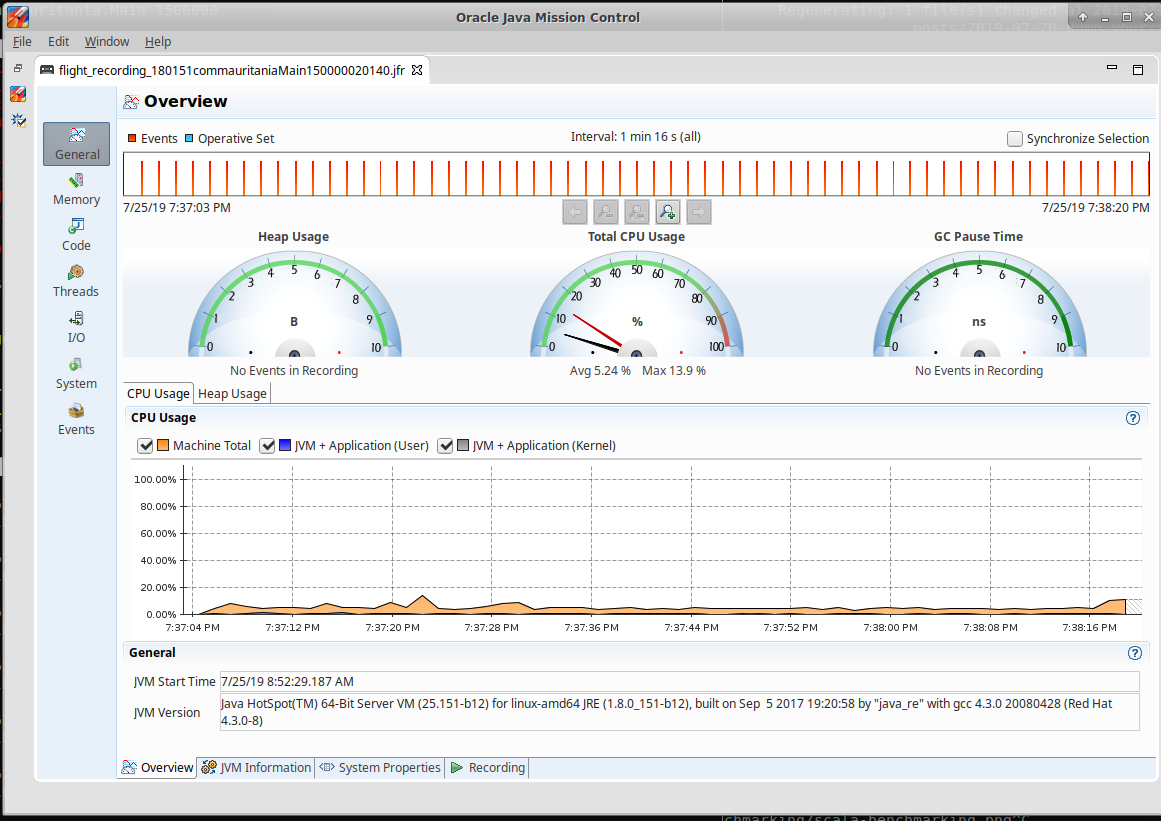
e. See general performance indicators, their evolution in time too
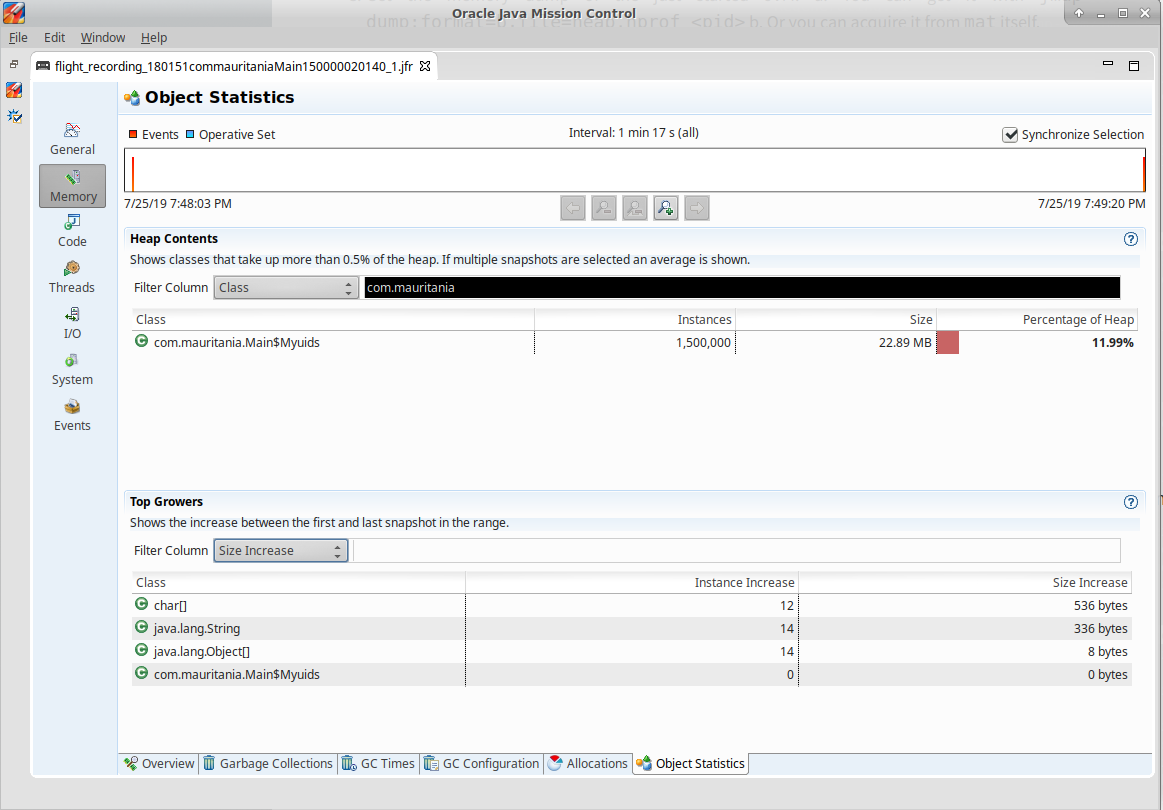
f. Go deeper into memory consumption under package org.mauritania
Extra notes
Use the following JVM settings to get garbage collection activities logs.
-XX:+PrintGCDetails
-XX:+PrintGCTimeStamps
